GoOmni.AI: Designing Intelligence for People Who Don't Speak Data
Founding Designer @ GoOmni.AI How I turned fragmented e-commerce data into a tool non-analysts could actually use.

ROLE
Founding Designer
TIMELINE
05/2024 - Present
Problem
Picture a merchant on a Tuesday morning. Sales dropped 18% yesterday. She opens Shopify Analytics, stares at the numbers, and has no idea what to do next.
It's not that the tools are broken. GA4 and Shopify give her plenty of data. The problem is the data speaks a language she was never meant to learn — session counts, bounce rates, CTR. She understands her business. She doesn't understand her metrics.
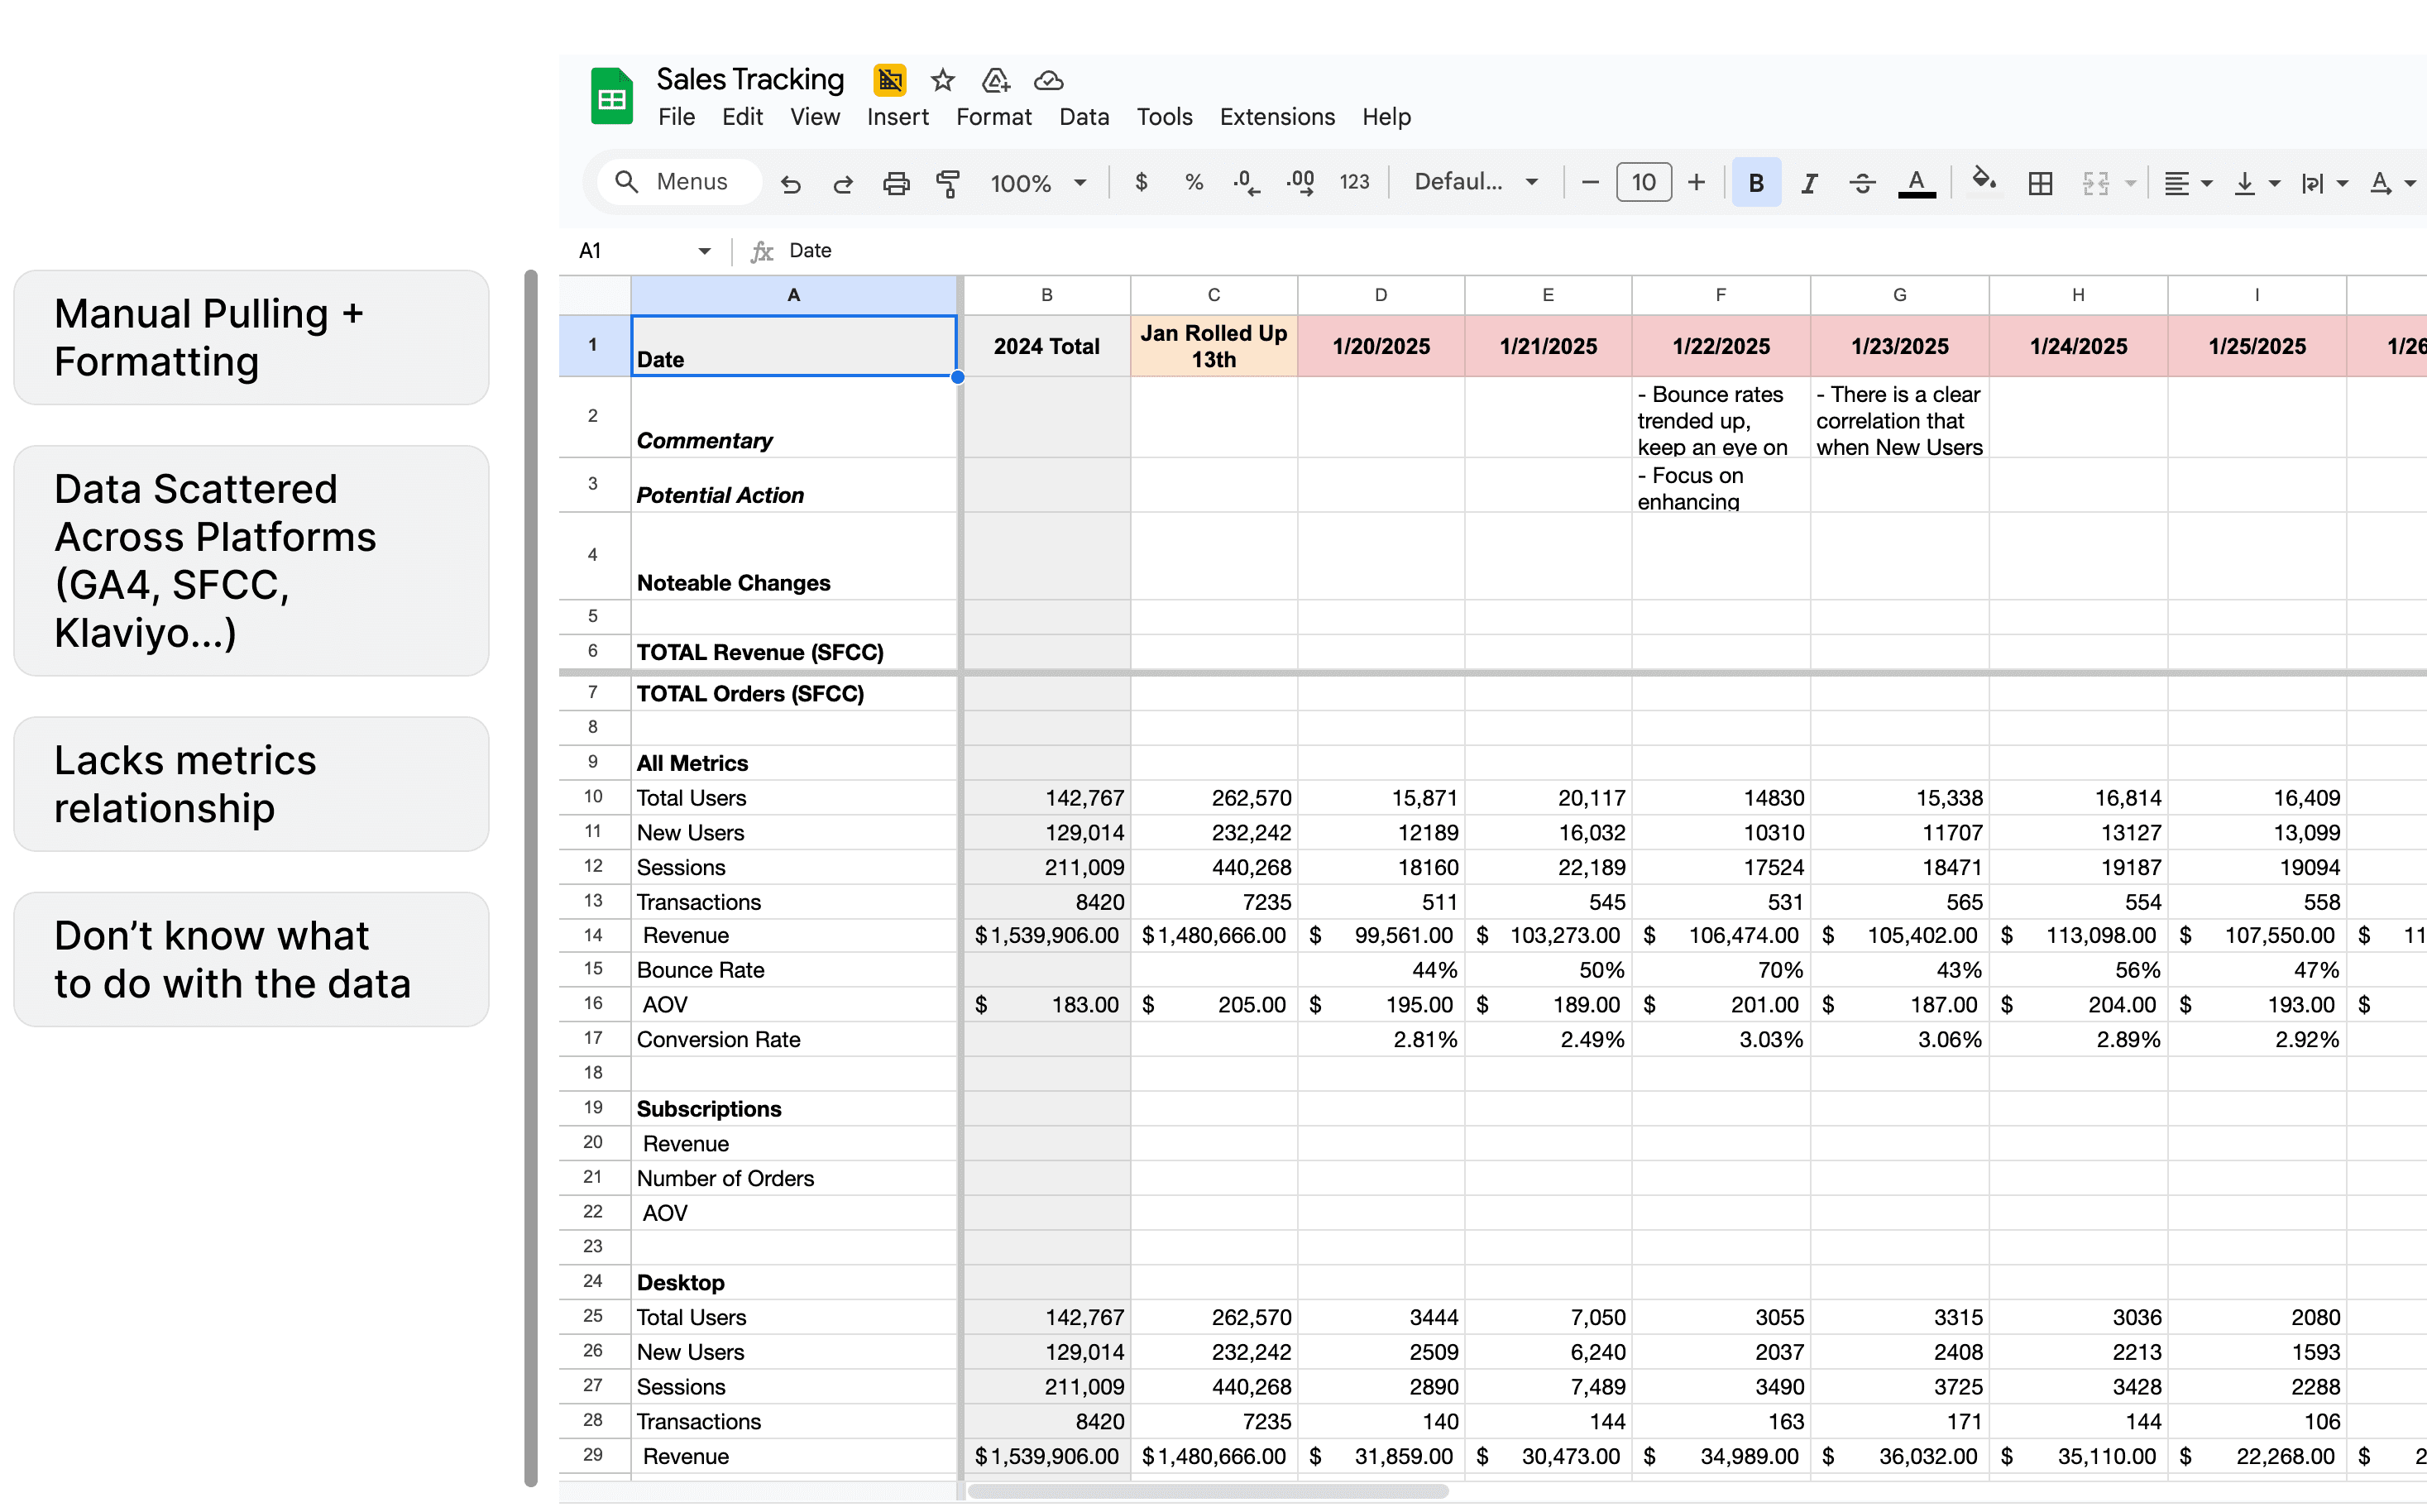
Making it worse: the data she actually needs is scattered across three platforms — GA4, SFCC, Klaviyo. Getting a complete picture means exporting CSVs, stitching spreadsheets, doing math. Every single morning. Fifteen to twenty hours a week before any real work can begin.
Two problems. Not one.
The obvious problem was fragmentation — data in three places. But the harder problem was interpretation — even when the data was together, merchants couldn't act on it.
Most analytics tools solve the first problem. Nobody was solving the second. That's where GoOmni.ai needed to go.
My Role
Founding Designer. No roadmap, no brief, no precedent.
I partnered with the founder to move GoOmni.Ai from a data aggregator to an intelligence hub. I used AI as the translator between raw data and human decisions.
As a designer, my job was three things:
Understand the data logic — what each platform tracks, what signals actually mean
Decide what AI should say — each scenario needs different language, urgent or informational, depending on what's happening
Design how AI says it — tone, structure, when to speak and when to stay quiet
I worked closely with engineering, they built it, I defined what it should say and when. The judgment was mine. The implementation was theirs.
Early on, I sat with merchants and asked them to describe their worst Monday mornings. They didn't say "my CTR dropped." They said:
"People aren't finding us."
"People browse but never buy."
"Nobody comes back after the first purchase."
They were already thinking in stages. They just had no tool that reflected it.
That insight drove the core design decision: organize everything around a marketing funnel — Awareness, Engagement, Lead, Retention, Advocacy — mapped to the exact language merchants used to describe their problems.
When we put early prototypes in front of users, they immediately started pointing at stages without any prompting: "This one — this is where we're losing people." The structure worked because it wasn't new to them. It was just finally visible.
The harder decision was what to show inside each stage.
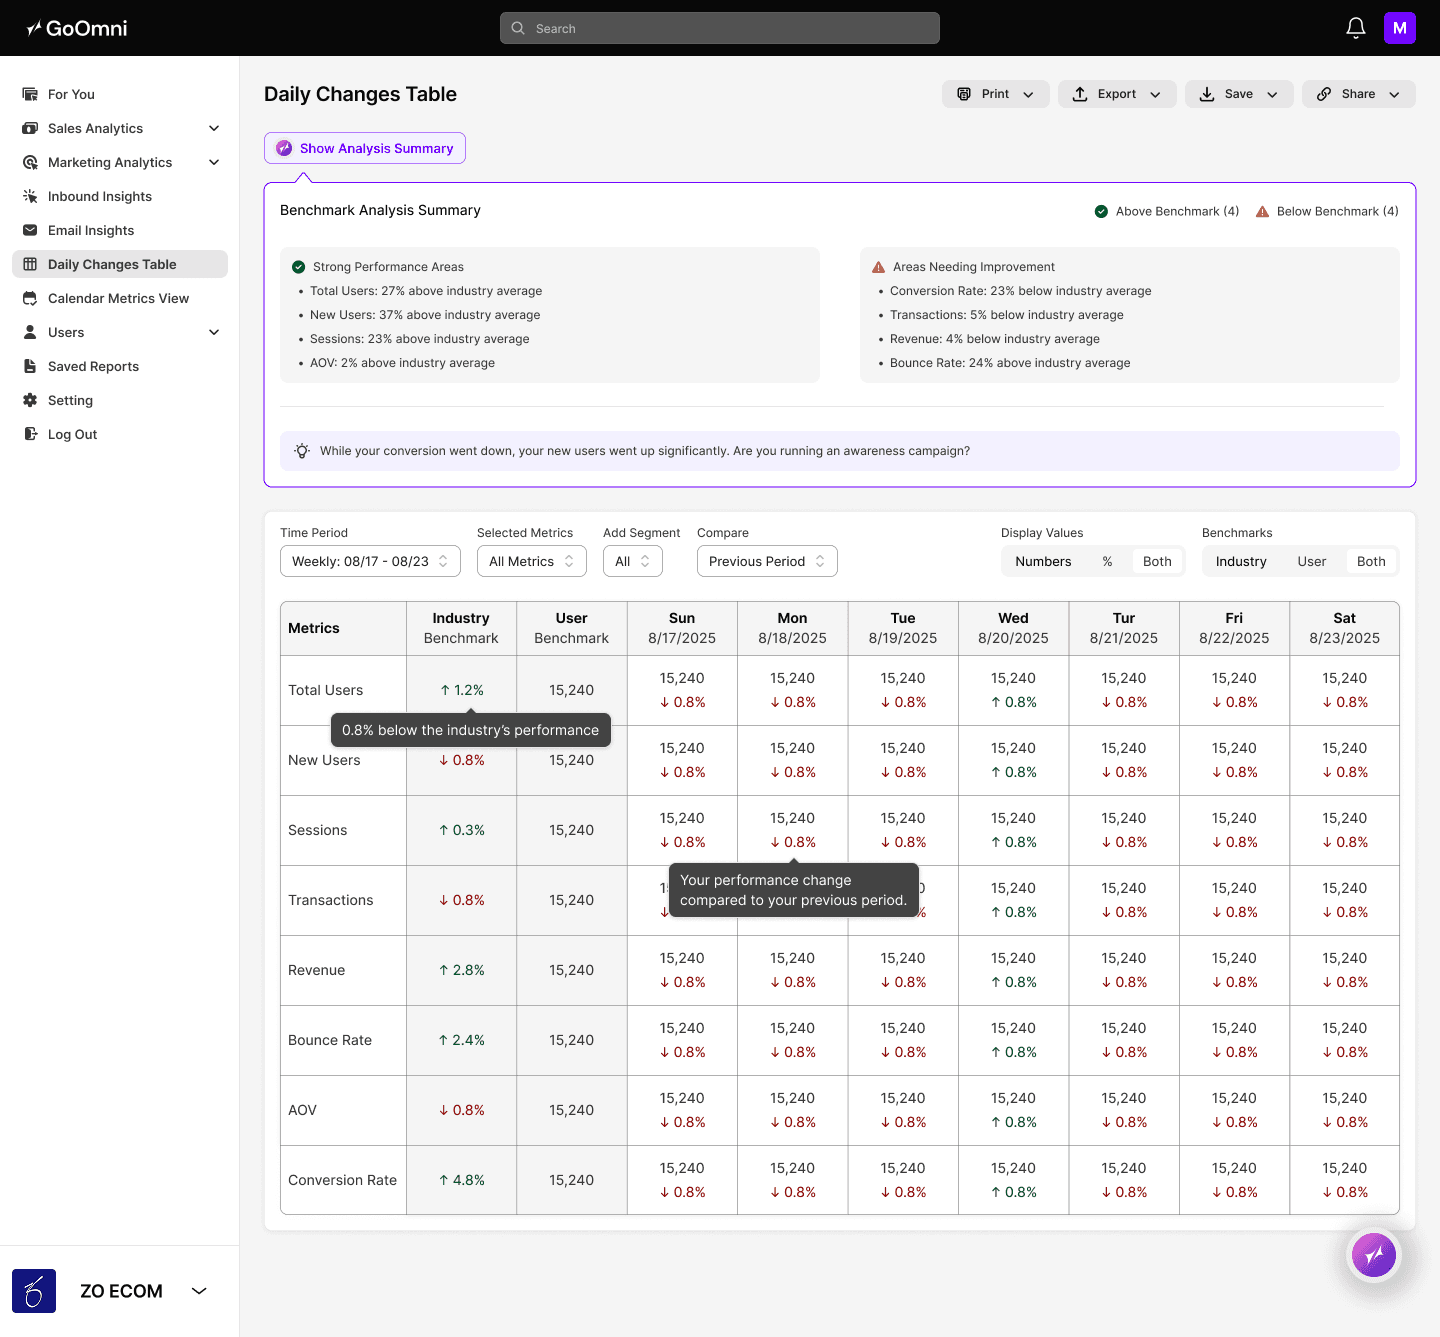
Raw numbers still required interpretation. So instead of metrics, each stage surfaces a simple signal — Needs Attention or Looks Good. This required real logic underneath: a dip in Awareness means something different than the same dip in Retention, so the threshold had to be stage-specific, not a generic week-over-week comparison.
For merchants who want to go deeper, each stage expands — metrics by urgency, channel breakdowns, and AI summaries that skip the numbers entirely.
The AI Layer: From Reporter to Advisor
The funnel gave merchants a way to read their business. But it surfaced a second problem: the data feeding each stage was incomplete.
GA4, SFCC, and Klaviyo don't talk to each other. An Engagement signal without email data is half a picture. A Retention number without transaction history is a guess. Merchants could now see where to look — but they couldn't fully trust what they were seeing. And assembling complete data still meant the same manual process every morning.
So we went back and solved the data layer — building around how merchants actually move through their day.
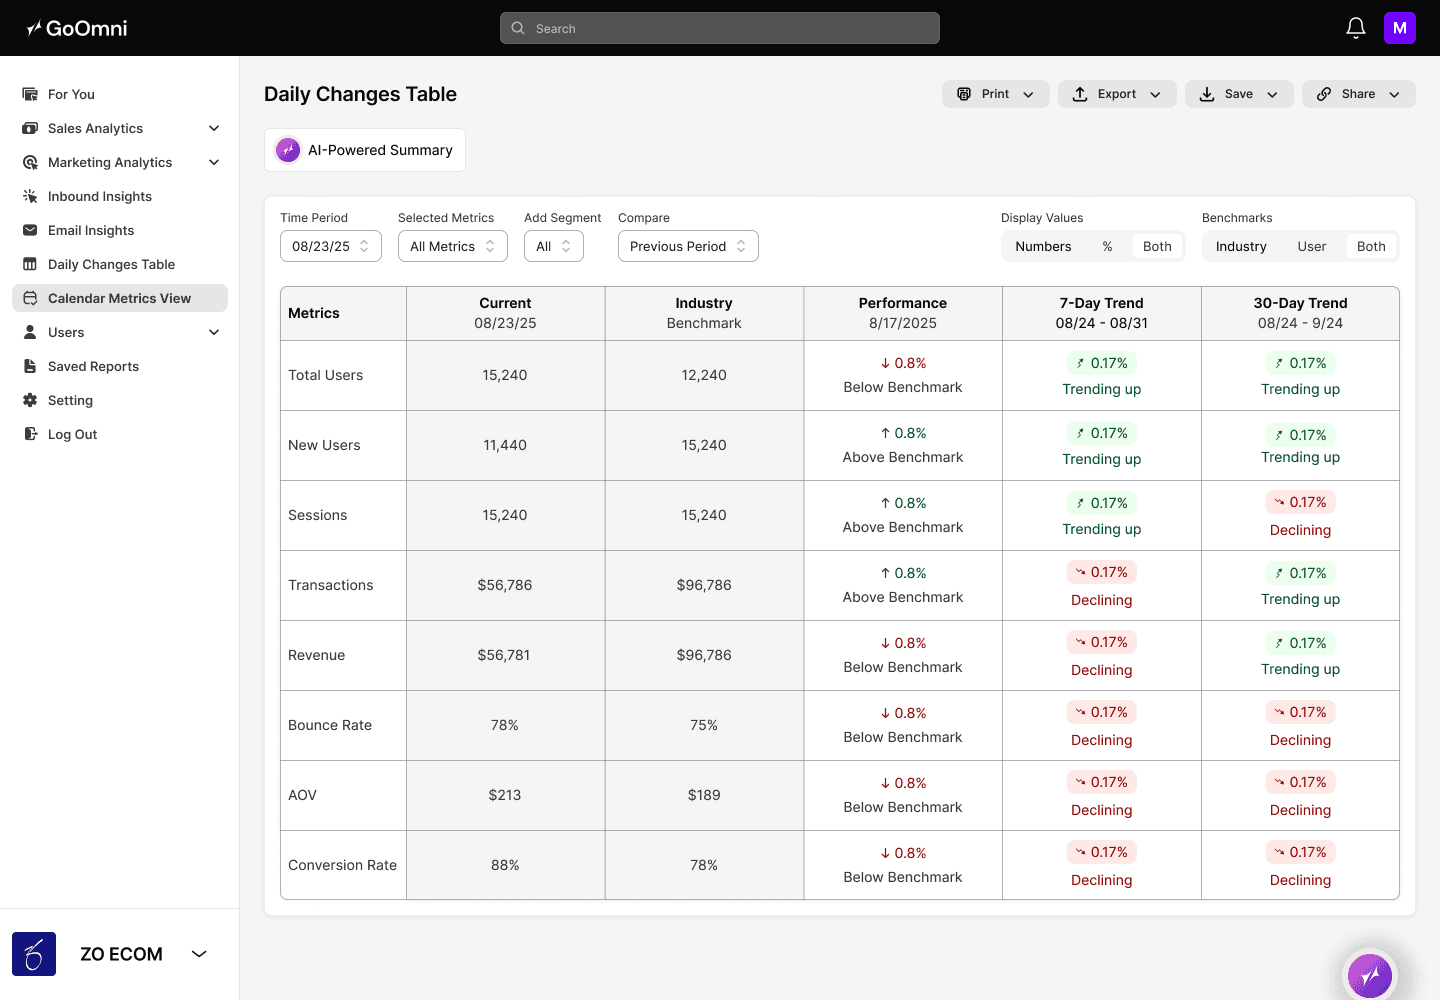
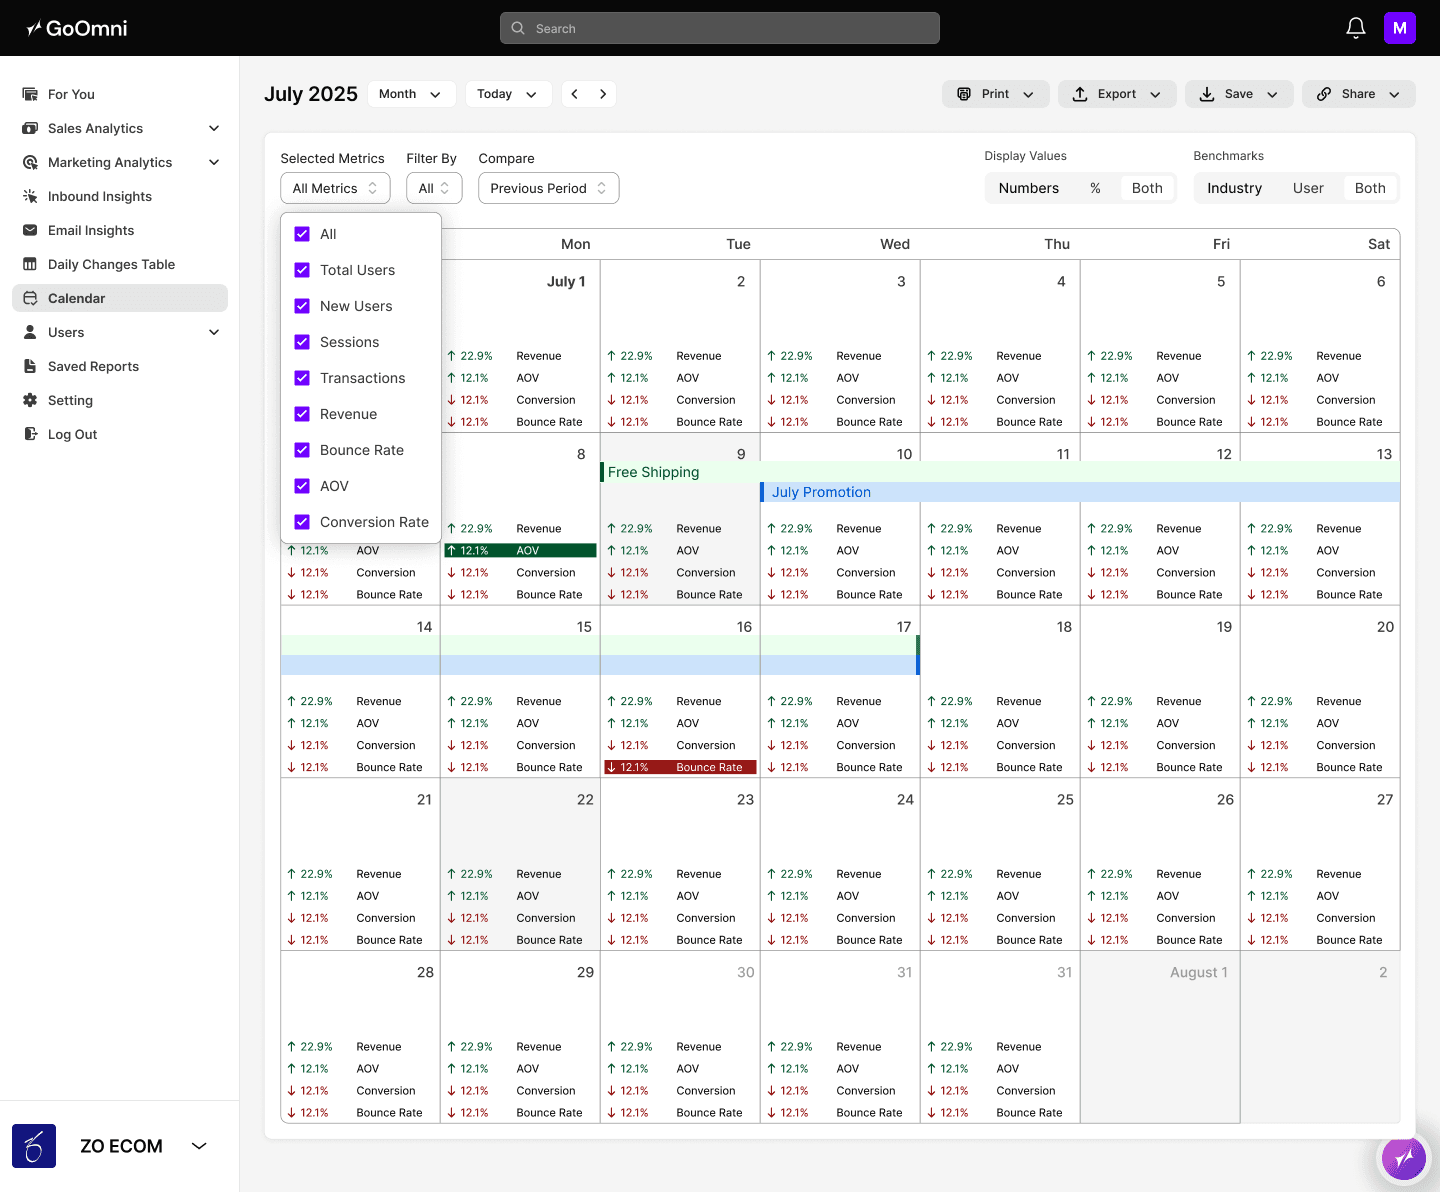
Morning Check — Unified Pulse Dashboard
Before anything else, merchants needed to get oriented. Every morning started the same way: open three tabs, pull three exports, do the math. We called it the Morning Panic — and it consumed the most productive hour of the day before any real work could begin.
The Pulse Dashboard consolidates GA4, SFCC, and Klaviyo into one view. The Morning Panic becomes a 5-second glance. Merchants arrive at their actual work faster, with a complete picture already in front of them.
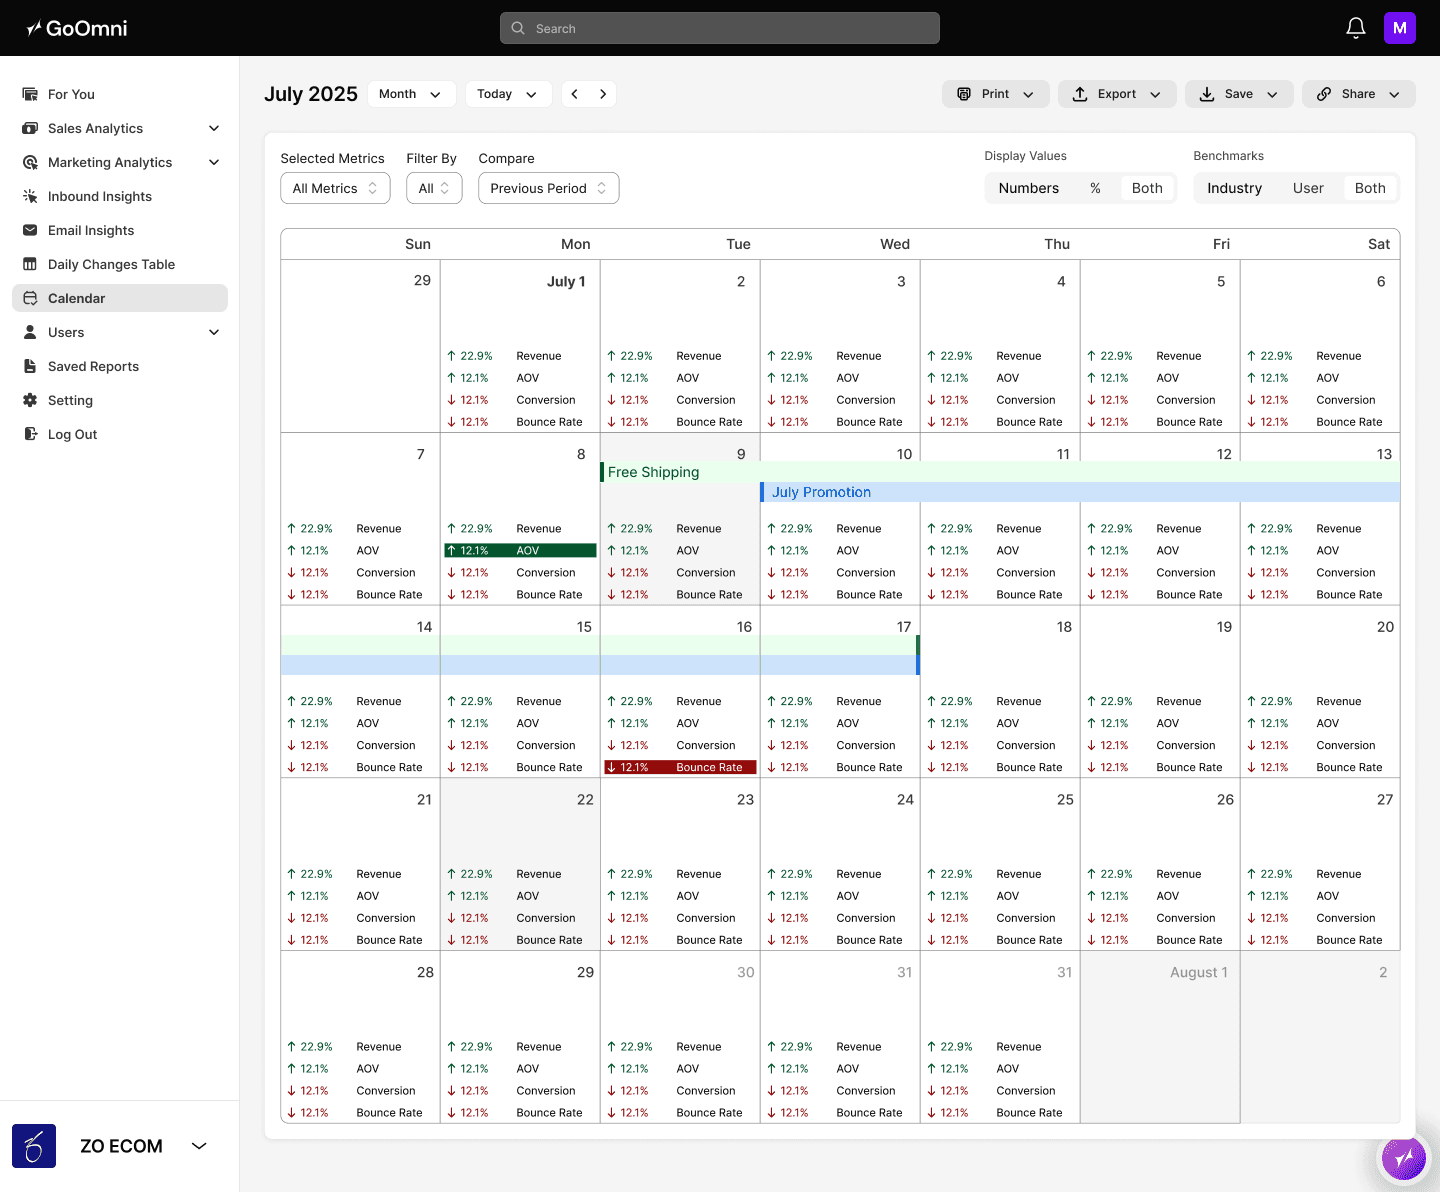
Deep-Dive — Dimension Grouping
A merchant notices a revenue spike. Was it the Klaviyo campaign, paid social, or organic? Before, answering that meant exporting from multiple platforms, building a pivot table, and hoping the math held up.
Dimension Grouping automates those cross-platform relationships. Slice by channel, device, or campaign in seconds — no spreadsheet, no manual math, and an answer you can actually trust.
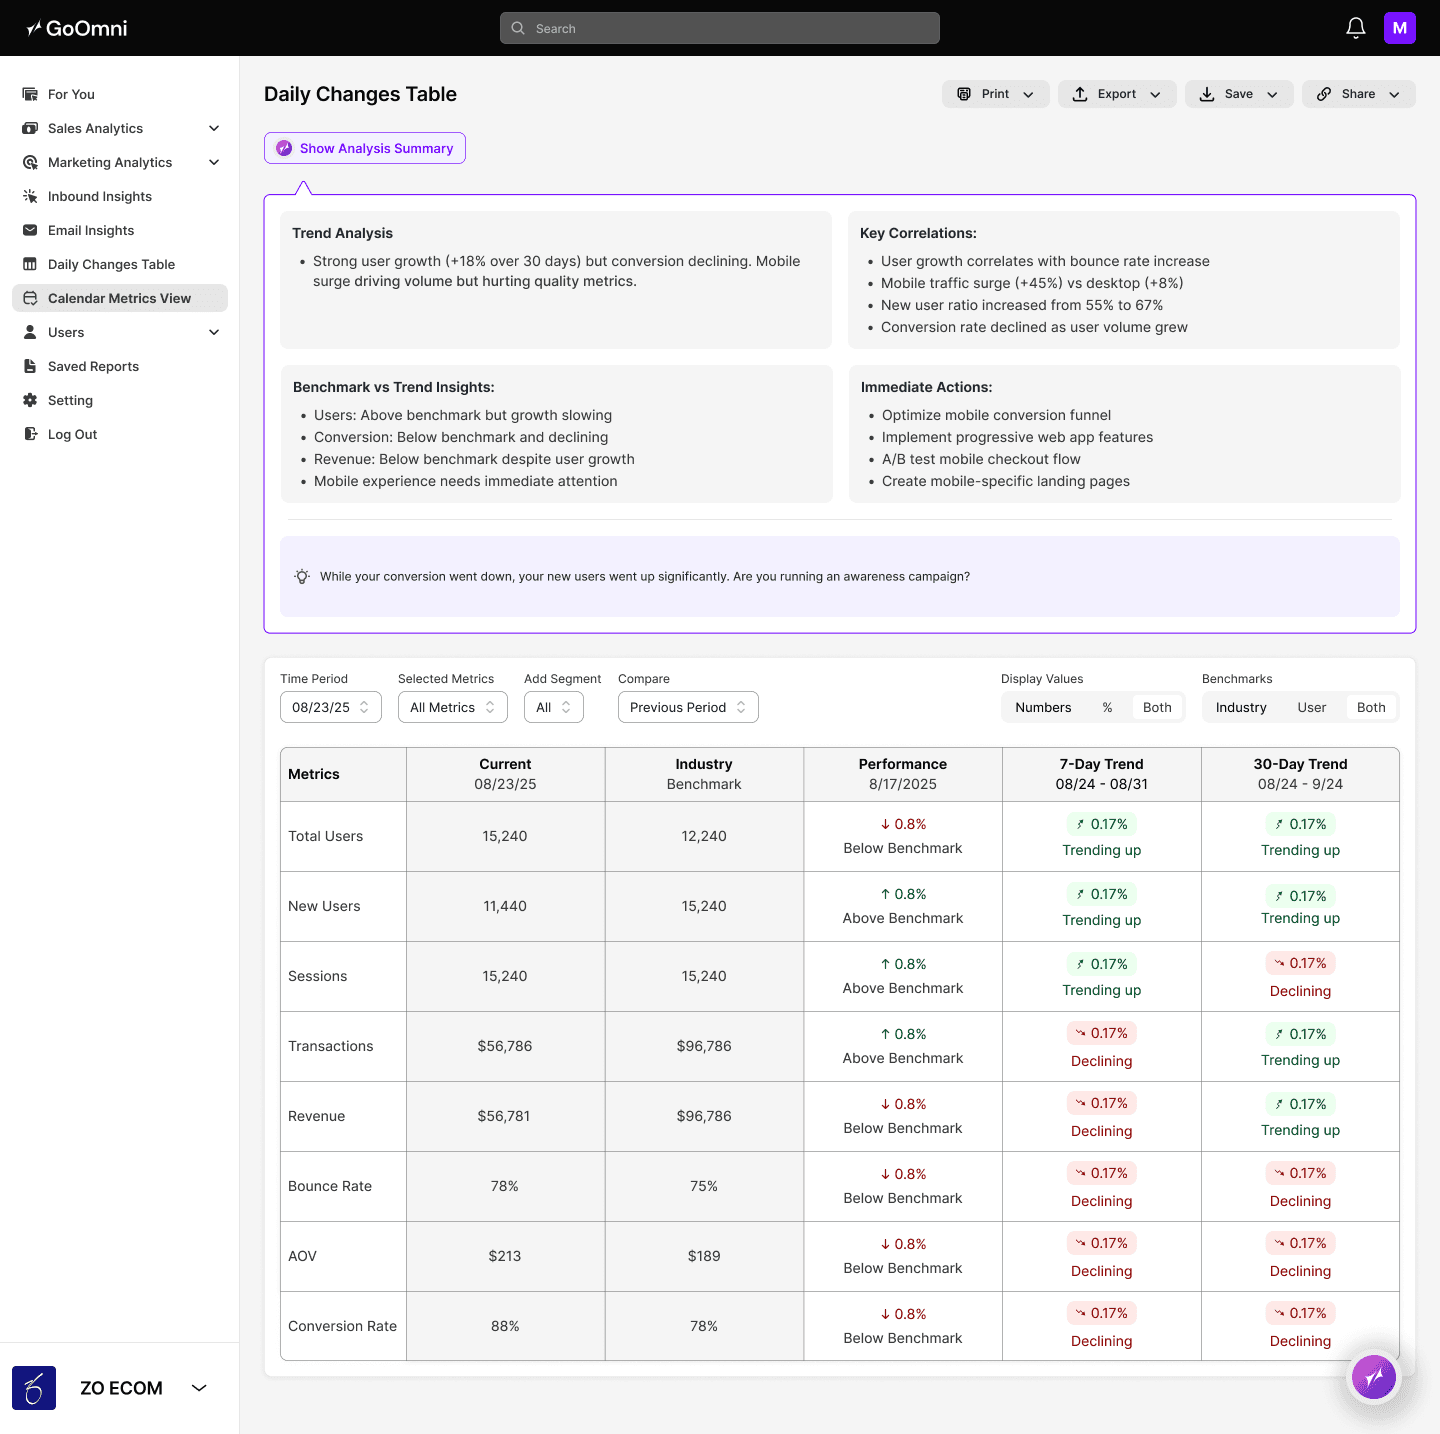
Future Planning — Glass Box Insight Cards
Merchants were ignoring AI forecasts entirely — not because they weren't valuable, but because they didn't trust them. A prediction with no explanation is just noise. If you can't see why the AI thinks sales will drop next week, you don't adjust your budget based on it. You scroll past it.
Transparency is what builds trust. Glass Box Insight Cards expose the specific variable behind each forecast — the underperforming channel, the drop in repeat visits, the email trend. Not just what will happen, but why. That change turned forecasts from something merchants scrolled past into something they used to make real decisions.
What I Learned
Designing for AI output is different from designing with AI tools.
Most designers are learning to use AI in their workflow. I was designing the rules that govern what AI says to users. That requires a different skill: you have to understand the data logic well enough to define the judgment layer — when something is urgent, when it's informational, when to speak and when to stay quiet.
Ambiguity isn't the enemy. Untested assumptions are.
I had no brief, no roadmap. My first move was to sit with the founder, form a hypothesis, and put rough prototypes in front of real users as fast as possible. The feedback loop replaced the brief I didn't have.
Results
GoOmni.AI launched November 2024. Still actively iterating based on founder and early user feedback.
The merchant on Tuesday morning — the one staring at a number she couldn't explain — this is what we were building for. Early users report spending significantly less time assembling data and more time acting on it. The product is live, and the work continues.